Macroseismic methods
The fundamental concept in macroseismology is earthquake intensity. This is a measurement, or rather a classification, of the strength of shaking of an earthquake at a particular place, based on the observations made of the different effects. The procedure is very similar to that for measuring wind strength with the Beaufort Scale. An intensity scale provides a series of idealised descriptions of the effects of an earthquake, starting with the very weakest (the shaking is imperceptible) up to the very strongest (everything is totally destroyed). The seismologist collects observations from ordinary people and attempts to match them to the descriptions in the intensity scale. If the effects from a certain place best match the description for degree 5 of the scale, then intensity 5 is assigned for that place. It's simple, low-tech, and surprisingly effective. The stages of a macroseismic investigation are something like this: (i) The earthquake happens. The seismologist quickly tries to get an estimate of the total area likely to have been affected by the earthquake. This may be estimated from the size (magnitude) of the earthquake, or from information received via telephone calls from the public and from police. 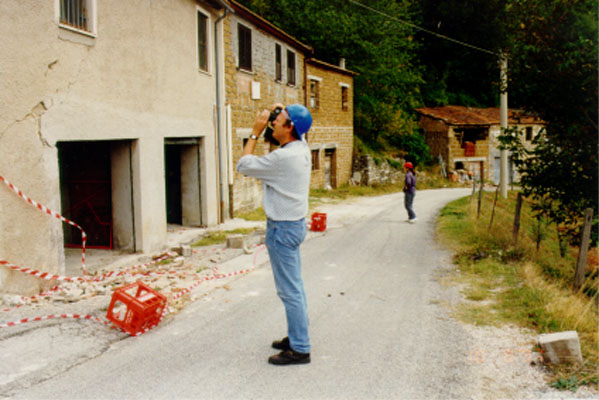 A seismologist inspecting damaged buildings (ii) The seismologist collects information from this area. There are three main methods. In cases where there was significant damage, the seismologist will want to see this first hand in company with an engineer. Detailed field surveys are the best way of studying the damage distribution of an earthquake. The second method is by distributing a questionnaire that covers all the most important types of information on the earthquake effects: how strong was it, what were the effects on people and houses, and so on. The questionnaire may be sent by post to selected individuals, or to schools, or public officials, or distributed by hand, or published in a newspaper - the method varies from country to country. Lastly, it is increasingly the case that data can be collected best by the use of an online internet questionnaire. This provides a means for the public to supply data to the seismologist very quickly. You will find the link to the BGS online macroseismic questionnaire here. 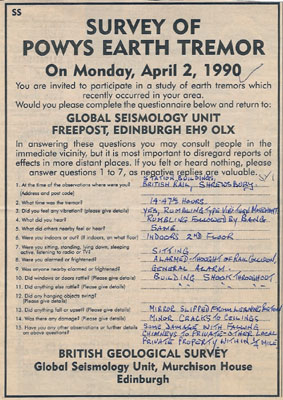 A traditional paper questionnaire (iii) Once the information has been collected, it has to be sorted by place. (iv) For each place, the seismologist compares his information with the intensity scale descriptions, and assigns a number (the intensity value). In most modern scales this will be a number from 1 to 12 - only integer numbers are used. Ideally, the number to be assigned will be clear, but in practice, the data can sometimes be confusing or insufficient. In that case, the seismologist will either give a range value, eg 5-6, meaning 5 or 6, or will just give an "F" for "felt" if the information is just too vague. (v) Once all the numbers have been assigned, they can be plotted on a map. The resulting intensity map gives a comprehensive picture of the pattern of effects of the earthquake. Usually, contours are drawn around the areas over which each intensity has been observed. These contours are called isoseismals. 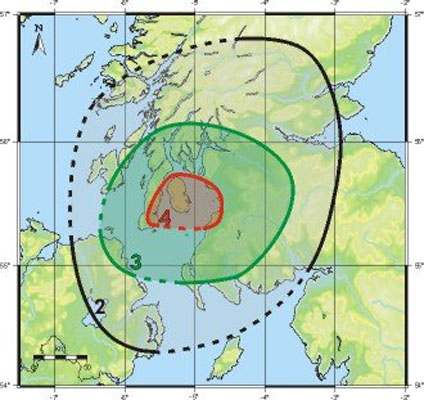 Isoseismal map of the 1999 Arran earthquake Typically, the intensity values for an earthquake will be highest near the epicentre and gradually decrease with distance. The decay of intensity with distance is called attenuation. It is usually found that the shapes of isoseismals are generally elliptical. The direction of the long axis of the ellipse sometimes indicates the orientation of the fault that produced the earthquake (but not always). Drawing isoseismals is not always straightforward, as intensity values on a map can be quite mixed up. If you are trying to draw the contour, say, for intensity 5, you will often find that drawing a line that takes in every 5 value also takes in a lot of 4s. This is undesirable. The line should encompass the area within which the intensity is predominantly 5. There are no hard and fast rules for achieving this. Experience shows that if you give the same intensity map to a dozen different seismologists for contouring, you get a dozen different maps back, with different degrees of wigglyness in the lines. But the overall results will be similar, which is what matters in the long run. One must never confuse intensity with magnitude. This is an error frequently seen in newspaper reports. What happens is the seismologist dealing with an earthquake gives out information that the maximum intensity of an earthquake was, say, 9. Someone repeats this information and leaves out the word "maximum", and says the intensity of the earthquake was 9 (this makes no sense, since any earthquake causes different intensities at different places). The news agencies then abbreviate this further and say "the earthquake measured 9". The newspaper reporter then takes this and assumes it refers to "the Richter Scale" (ie magnitude) and says that the earthquake was 9 on the Richter Scale, which is totally false. You see this again and again. In order to try to prevent people (a) mixing up intensity and magnitude, and (b) attempting to give fractional intensity values, many seismologists always use Roman numerals when writing intensities, i.e. they write VIII instead of 8. This is fine, but now that most intensity databases are kept on computer, it becomes very awkward to handle Roman numerals, and the fashion has swung back to Arabic numerals. |