
Blackpool earthquake | Magnitude 2.3 | 1 April 2011
| Date | 1 April 2011 |
|---|---|
| Origin time | 02:34 32.3s UTC |
| Lat/Lon | 53.834° North / 2.975° West |
| Grid ref | 335.84 km/E / 437.99 km/N |
| Depth | 3.6 km |
| Magnitude | 2.3 ML |
| Locality | Blackpool, Lancashire |
| Intensity | 3 EMS |
The BGS are unable to conclusively say if the magnitude 2.3 ML earthquake that occurred near Blackpool on 1 April 2011 at 02:34 was related to ongoing hydraulic fracturing, for shale gas, at the Preese Hall drill site.
Our calculated epicentre places the event approximately 2 km from the Preese Hall drill site (Figure 1).
However, the depth of 3.6 km is poorly constrained, since our nearest seismograph station is around 80 km from the epicentre. This lack of resolution means we cannot determine if the event was related to the fluid injection at the Preese Hall site, which we understand occurred between depths of 2–3 km.
We would not expect an earthquake of this size to cause any damage.
Twenty-three reports of the shaking caused by the earthquake were used to determine earthquake intensity.
We find a maximum intensity of 4 EMS close to the epicentre. This is consistent with a magnitude 2.3 earthquake at a depth of 3.5 km, however, the limited nature of the data means that this is also poorly constrained.
Instrumentation much closer to the site, as well as a detailed record of dates and times of injection are required to identify any relationship between the injection process and any seismic activity in future.
Earthquake location

We used 23 phases from 16 different stations to determine a location for the earthquake (Figure 2).
Phases from stations within 100 km of the epicentre (red triangles) have the greatest weight in determining the solution.
Phases from stations at 100–150 km have their weighting is reduced by a distance factor.
Phases from stations at greater than 150 km were not used in the solution. The epicentre, calculated using the program HYPOCENTER (Lienert et al., 1986), places the event at 335770 East, 437547 North. This is about 2 km from the Preese Hall drill site.
We obtain a depth for the event of 3.6 km, but this is poorly constrained, since our nearest seismograph station is around 80 km from the epicentre.
This lack of resolution means we cannot determine if the event was related to the fluid injection at the Preese Hall site.
We understand that fluid injection in the well was between depths of 2–3 km and would expect any induced activity to be around this depth.
The location errors are ± 1.1 km in the northing, ± 2.2 km in the easting and ± 7.1 km in depth.
The average magnitude, calculated using data from 26 horizontal channels was 2.3 ML.
Error analysis
We obtain additional estimates of the hypocentral errors by bootstrap resampling, with P- and S-wave arrival times from all stations randomly perturbed to specified maximum values, then used as a new input data set for the HYPOCENTER program.
This process is repeated many times to give an estimate of the variability in the results.
The interdecile ranges of longitude, latitude and depth are then used as a robust measure of the statistical dispersion of each parameter. In this case we used 100 iterations and the maximum perturbations for P- and S-wave arrivals were 0.25 and 0.5 seconds respectively.
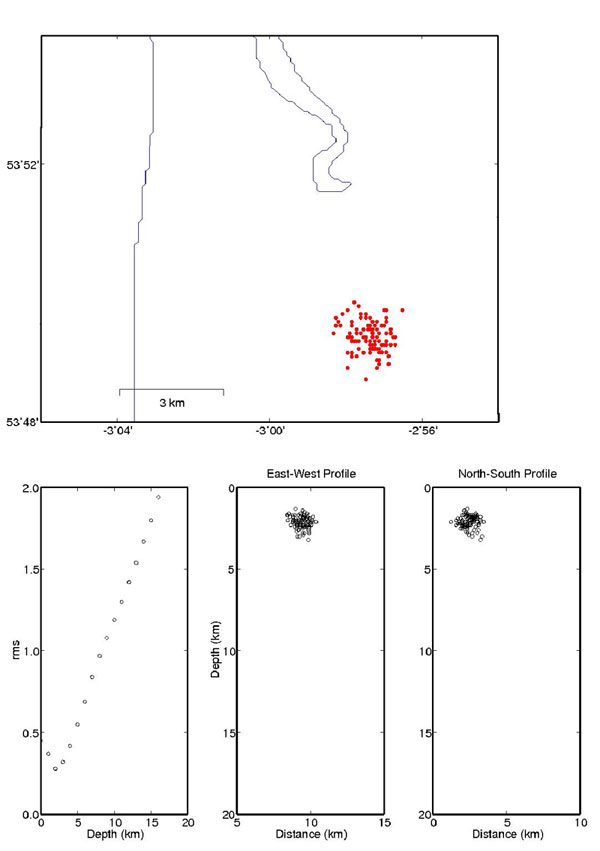
The results are shown in Figure 3.
Figure 3 (a) shows the resampled epicentres along with the error ellipse for hypocentre determined using the unperturbed data.
Figure 3 (b) shows the RMS error in the hypocentre determined using the unperturbed data. The lowest RMS is found for depths between 3 and 7 km.
Figure 3 (c) and (d) show east–west and north–south cross-sections of the resampled solutions, which clearly show the uncertainty in the depth estimate.
Errors were found to be 0.8 km, 0.9 km and 3.6 km in longitude, latitude and depth respectively.
Macroseismic data
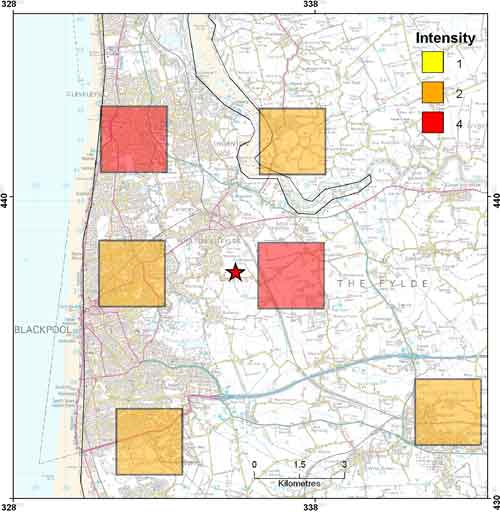
We received 23 detailed reports of the shaking experienced by people who felt the earthquake.
These were used to determine earthquake intensity in a number of 5×5 km grid squares. We find a maximum intensity of 4 EMS close to the epicentre.
This is consistent with a magnitude 2.3 ML earthquake at a depth of 3.5 km, however this is also poorly constrained because of the limited data.
The results are similar to those often obtained for shallow coalfield earthquakes in the UK.
Regional seismicity
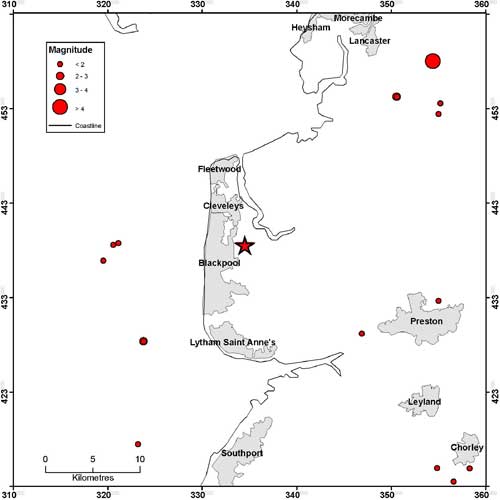
The Blackpool region is an area of low seismicity even for the UK.
A magnitude 2.5 ML earthquake in 1970 was 5 km south-west of Blackpool.
There have also been a number of smaller earthquake immediately offshore.
The magnitude 3.7 Ulverston earthquake on 28 April 2009 was also felt in Lancashire.
Historically, the largest earthquake in the region was a magnitude 4.4 earthquake near Lancaster in 1835 with a maximum intensity of 6 EMS.
Fluid injection
Any process that injects pressurised water into rocks at depth will cause the rock to fracture and possibly produce earthquakes.
It is well known that injection of water or other fluids during processes such as oil extraction, geothermal engineering and shale gas production can result in earthquake activity.
Typically, the earthquakes are too small to be felt, however, there are a number of examples of larger earthquakes occurring.
The Hot Dry Rock Geothermal energy research project at Rosemanowes, Cornwall resulted in many thousands of induced earthquakes. However, only one, the largest with a magnitude of 2.0, was felt.
Conclusions
We are unable to conclusively say if the magnitude 2.3 earthquake that was related to ongoing hydrofracturing at the Preese Hall drill site.
Our epicentre places the earthquake approximately 2 km from the drill site, which falls within the area of error.
However, our depth of 3.6 km is poorly resolved as the nearest station is 80 km away from the epicentre. This means that the depth errors are large.
Instrumentation much closer to the site, as well as a detailed record of dates and times of injection are required to identify any relationship between the injection process and any seismic activity in future.
Contact
Contact Brian Baptie for further information
- A Comparison of the Folkestone and Market Rasen Earthquakes
- Seismogenesis and State of Stress in the UK
- Monitoring Volcanic Eruptions Using Interferometry
- Particular events
- Are yesterday's earthquakes tomorrow's disasters?
- Creating 'virtual seismometers' deep inside the Earth
- Is earthquake activity related to the Moon or Sun?
- Is earthquake activity increasing?