Probabilistic Seismic Hazard Assessment (PSHA)
The probabilistic method for seismic hazard assessment is the one most in favour today. It is flexible, and takes into account as much data as you can throw at it. However, it is not without its critics.
The basic theory goes like this: suppose you have a site of interest at a particular point. Suppose you have an area nearby in which earthquakes happen, and this source zone can be demarcated such that earthquakes have an equal probability of occuring at any spot in this zone. Furthermore, you have a catalogue of earthquakes that have occurred in the zone before, so you can work out the probability of an earthquake of a given magnitude occurring in the zone in some future period.
Let's say you want to calculate the hazard values for the next fifty years. Consider first a possible level of shaking, say intensity 6, and a possible magnitude of earthquake, say 5.5. If you know how rapidly intensity decreases as a function of distance from the epicentre (i.e. you have an attenuation law) then you can calculate how far away a magnitude 5.5 earthquake can be from the site and still generate at least intensity 6 at the site itself. Let's say the value is 30 km. Draw a circle 30 km radius round the site. A magnitude 5.5 earthquake occurring anywhere within the circle will cause at least intensity 6 at your site. Does the circle intersect the source zone? Let's say it does, and clips an area equal to 0.25 of the total area of the zone. We know the probability of a magnitude 5.5 earthquake occurring somewhere in the source zone in 50 years, and since it can occur anywhere in the zone with equal likelihood, we can multiply the probability by 0.25 to find the probability that an earthquake of magnitude 5.5 in the source zone will actually cause intensity 6 or more at the site in 50 years.
What you have to do next is repeat the analysis for every possible magnitude (and every source zone if you have more than one). You can then sum all the results in such a way as to calculate the total probability of exceeding intensity 6 in your 50 year period. You can then do the same thing for other values of intensity and other time periods to get a complete account of the hazard at your site, usually expressed as a hazard curve, which plots the decreasing probability of increasingly larger intensities.
The tricky part is defining the initial seismic source zone model. The earthquake catalogue one has to work with is often too short to show all the sorts of earthquakes that might happen in the future; it is therefore necessary to make a number of interpretative decisions based on both geological and seismological data in order to build up the zone model. Since small differences in the model can sometimes have quite large effects on the hazard at a site, it is important to take great care over the details of the model. This does mean that this type of seismic hazard analysis is a much more major undertaking than in the methodologies described previously. But on the other hand, the large amounts of data that can be used to justify the model do increase the power of the method.
A further refinement can be introduced: if some parameter (for example, the maximum magnitude that could occur within a zone) is imperfectly known, it is possible to introduce a range of possible values for this parameter, each with a weighting as to how credible the value is. By repeating the analysis for every possible combination of values of each parameter, one can calculate a mean hazard value that takes into account all the uncertainties in the original data. This can be very powerful if used carefully; alternatively it is possible to introduce so many arbitrarily assigned weighting values that the model loses touch with reality.
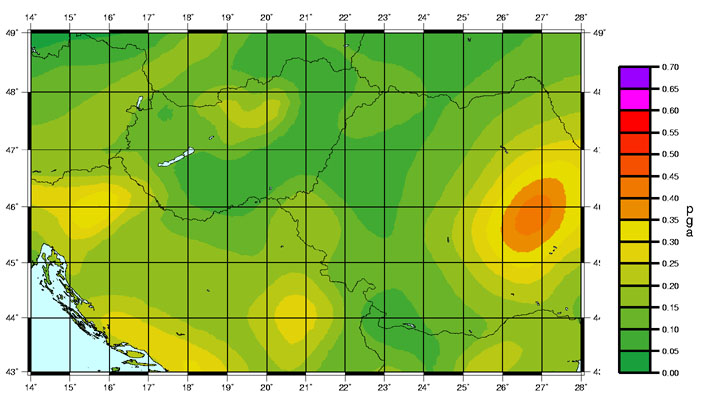
The PSHA technique is ideally suited to compiling hazard maps. Having drawn up the zone model for a large area, the calculations are made for a grid of points instead of just one, and the values are contoured to give a picture of the spatial variation of the hazard.
One objection to PSHA is the degree of subjectivity and personal judgement that goes into constructing the zone model. Some seismologists look for a way round this by using a smoothed version of the original seismicity in place of source zones. Unfortunately, this just moves the problem - you now have to make personal judgements about what sort of smoothing to apply; and you no longer can utilise geological data to inform your decisions.
The description of PSHA given above is the classic method first described by Allin Cornell in 1968. For routine work in BGS a completely different approach is used, which actually gives exactly the same results by a different route. If you have a seismic source model as described above, you find it completely describes expected future seismicity in terms of general spatial distribution and rates of occurrence. It won't tell you exactly what earthquakes will happen where and when, but it will lay down the behaviour that seismicity in the next 50 years will follow.
So one can actually use it to make a simulation of what the seismicity of the next 50 years might look like, right down to the shaking experienced at a site during each future earthquake. If one repeats this often enough, one gets a very good view of all the possible things that could happen. From a huge data set of simulated experience (say, 200,000 times 50 years) one can find very easily the probability of different strengths of shaking.
From this one can construct a hazard curve which turns out to be identical to the one you get from a conventional PSHA process. It shows that both methods are calculating real probabilities. The advantage of the simulation method is that you can look at all the simulated catalogues and see exactly where the hazard is coming from; the process is very transparent, which leads to greater reliability (and flexibility).