
- A Comparison of the Folkestone and Market Rasen Earthquakes
- Revised Seismic Hazard Maps for the UK
- Seismogenesis and State of Stress in the UK
- Monitoring Volcanic Eruptions Using Interferometry
- Particular events
- Are yesterday's earthquakes tomorrow's disasters?
- Creating 'virtual seismometers' deep inside the Earth
- Fault line living
- Is earthquake activity related to the Moon or Sun?
- Is earthquake activity increasing?
Manchester Earthquakes Sequence, October - November 2002
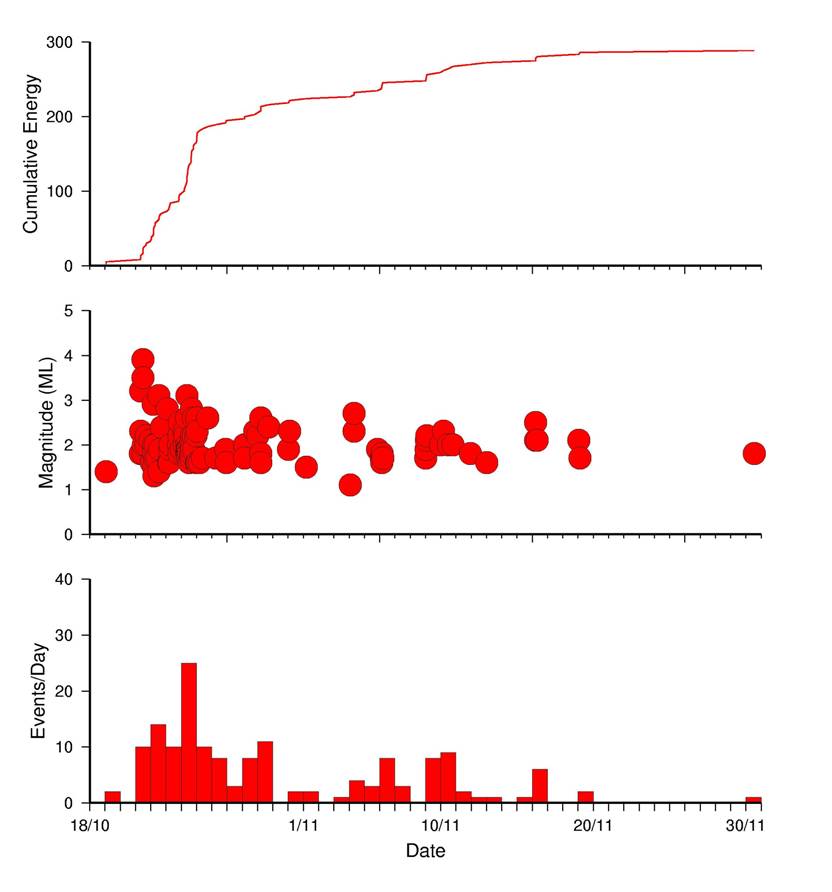
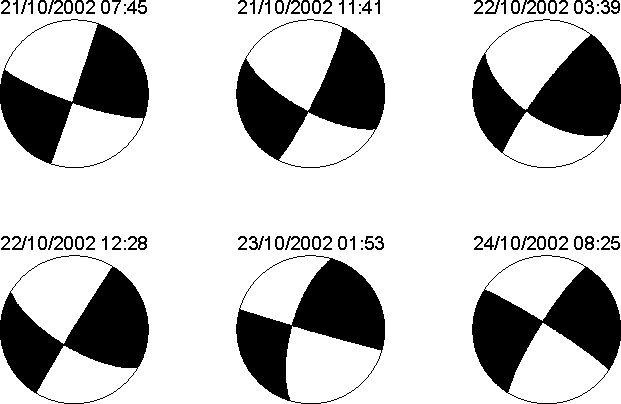
A sequence of more than 100 earthquakes started in the Greater Manchester area of the United Kingdom on October 19, 2002. Three temporary seismograph stations were installed to supplement existing permanent stations and to better understand the relationship between the seismicity and local geology. Due to the urban location, the events were experienced by a large number of people. The first earthquake that was felt occurred on 21 October at 07:45:15 (UTC) with a magnitude 3.2 ML. A few hours later at 11:42:34, there was a magnitude 3.9 ML earthquake, the largest in the sequence, which was strongly felt throughout the Greater Manchester area. About 22 seconds later there was another earthquake with a magnitude 3.5 ML. Numerous smaller earthquakes occured until the last event on 30 November 2011.
Precise Relocation
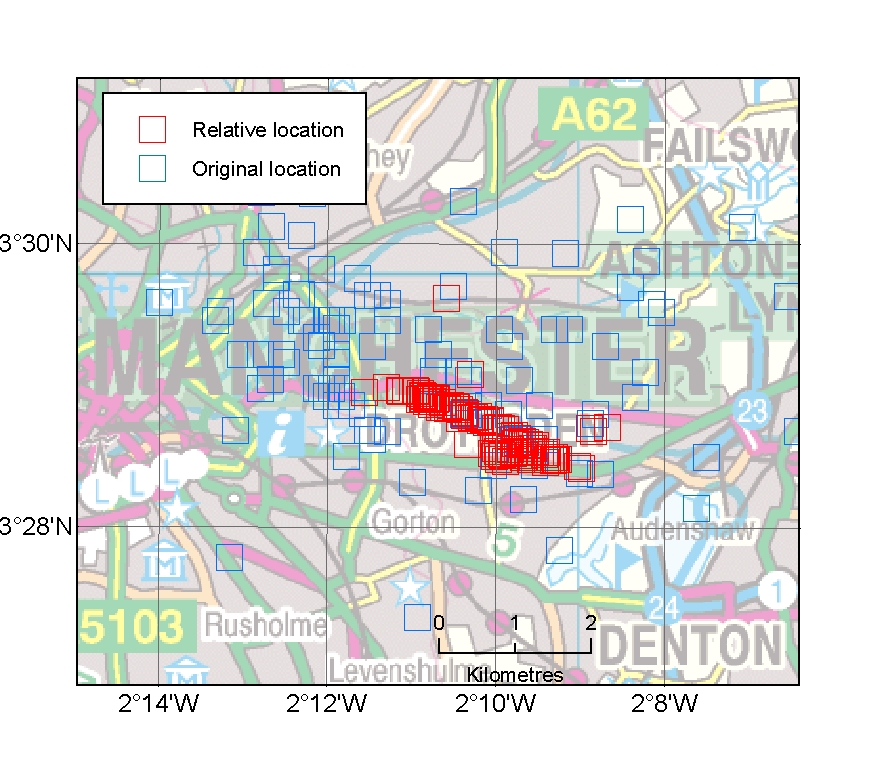
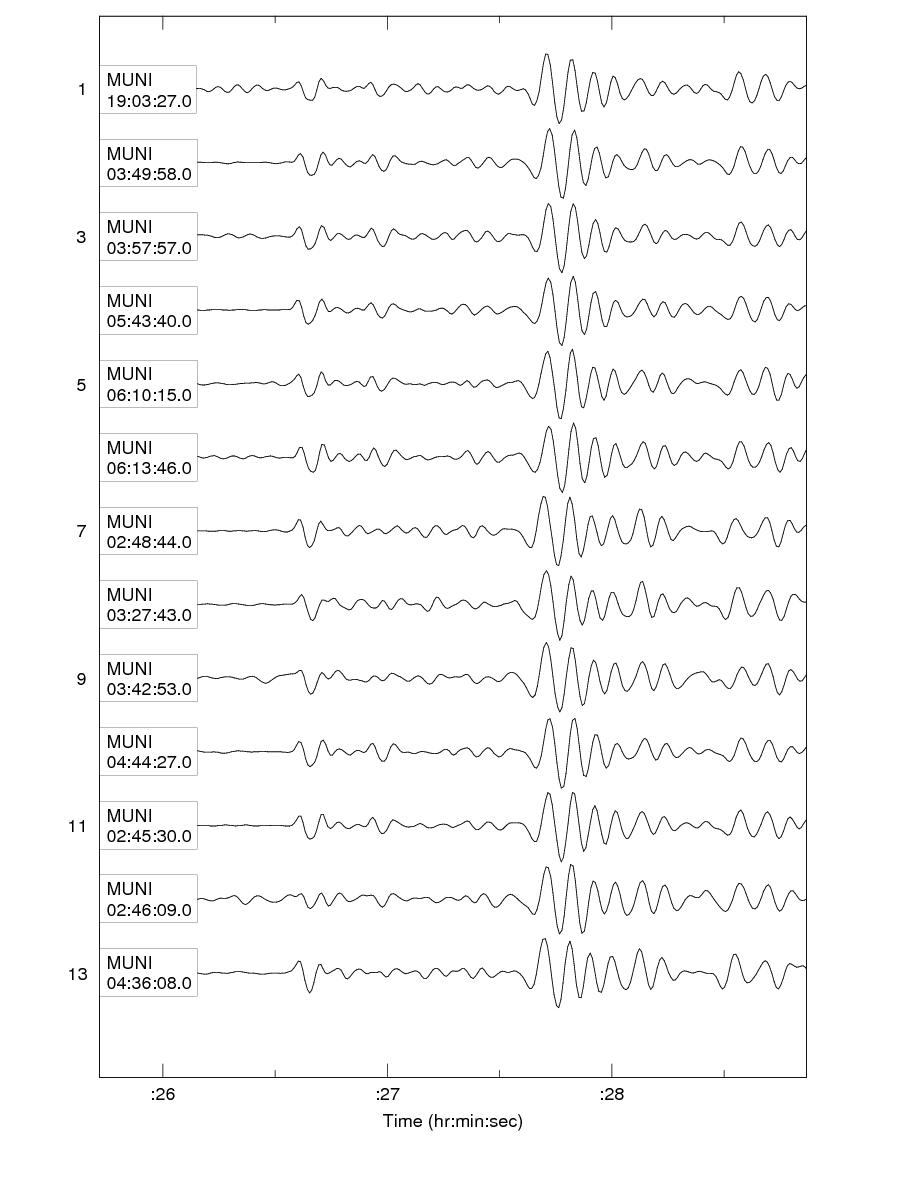
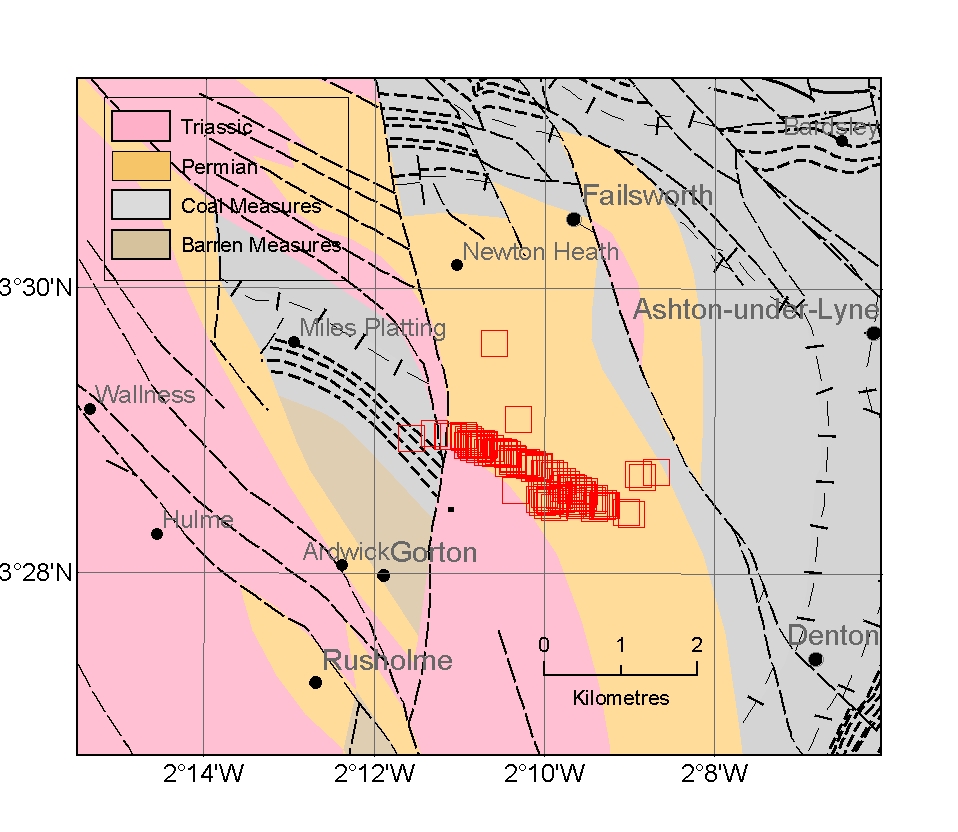
Analysis of the events in the sequence showed that many of them were very similar. Such similarity only occurs if the earthquakes are closely located and have a similar fault mechanism. We were then able to determine relative locations for the earthquakes by measuring small differences in the travel times of seismic waves between different events. The new locations show a strong alignment along a northwest-southeast trend (see map). Source mechanisms determined for the largest of the earthquakes suggest either northeast-southwest or northwest-southeast striking fault planes. The northwest-southeast plane agrees with the observed trend of the hypocentres, suggesting that this is probably the orientation of the fault plane. Numerous faults have been mapped at the surface, which mostly strike north-south or northwest-southeast. Again, a northwest-southeast strike agrees with both the strike of the epicentres and the calculated focal mechanisms. The coal measures in and around Manchester were worked extensively up to the 1970s. However, the earthquakes occurred at a depth of 6-7 km, which places them far below even the deepest mine workings.
Earthquake Swarms
Earthquake sequences can occur in two ways. Firstly, moderate to large size earthquakes are usually followed by aftershocks, which occur due to readjustment to a new state of stress. The duration of the aftershock sequence depends partly on the size of the event. Normally, the largest aftershock is about one magnitude unit smaller than the main shock. For example, the magnitude 5.4 ML Lleyn Peninsula earthquake that occurred in North Wales in 1984 was followed by some hundreds of aftershocks in the subsequent months, the largest of which was a magnitude 4.3 ML earthquake that occurred one month later.
Secondly, earthquake swarms are sequences of earthquakes clustered in time and space without a clear distinction of main shock and aftershocks. Such earthquake sequences or swarms are relatively common in Great Britain, examples include Comrie (1788-1801, 1839-46), Kintail (1974), Blackford (1997-98, 2000-01), Constantine (1981, 1986, 1992-4), Johnstonebridge (mid 1980s) and Dumfries (1991, 1999). The largest event in the Comrie sequence was a magnitude 4.8 ML earthquake in 1839.
Felt effects
The BGS received more than 3000 reports from people who felt the Manchester earthquakes. Most of the reports were from within 20 km from the Manchester city centre. Reports of minor damage, such as small cracks, falling tiles, shattered windows, falling rubble and plaster were also received. A maximum intensity of 5+ on the European Macroseismic Scale (EMS) was determined for the earthquake on October 21 at 11:42.
- Ottemoller and Thomas, (2007). Highland Boundary Fault Zone: Tectonic implications of the Aberfoyle earthquake sequence of 2003, Tectonphysics, 430, 83-95.
- Wauldhauser and Ellsworth (2000), A Double-Difference Earthquake Location Algorithm: Method and Application to the Northern Hayward Fault, California, Bull. Seism. Soc. Am, 90, 6, 1353-1368
- Seismogenesis and state of stress in the UK
- Earthquake Swarms: Wikipedia
- R.M.W. Musson (1996), The seismicity of the British Isles, Annals of Geophysics 39, 463-469.
- R.M.W. Musson (2004), A critical history of British earthquakes, Annals of Geophysics, 47 (2-3)